Real Estate Statistics
With the end of a year, we tend to look back and wonder how the market has changed. I have been collecting some year-end statistics, and thought I should make a graph to illustrate one important point about real estate: real estate is local. We have been hearing many national and local news reports lately about how the real estate market is struggling, and it is in many places especially volatile markets like Florida and California where prices are down dramatically and foreclosures are way up… The story is similar here, but the severity is not. If you measure our entire metro area (using info gathered from Heartland MLS), sales prices were down from 2006-2007 by just -1.6%. But if you narrow your search to Johnson County, the average sales price actually increased by 1.2%. Take it down even further and measure Prairie Village (a town in Johnson County in the KC metropolitan area), and the average sales price was up 5.1% from 2006-2007.
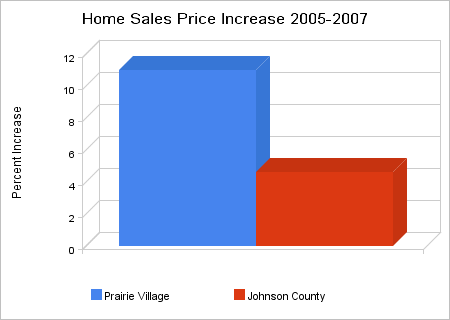
The graph above illustrates the point that real estate is local. If you are wondering about your home value, you really need to gather information about your neighborhood, area, city or whatever best applies to your situation. For example – I live in Brookside, so I would probably gather subdivision and zip code data to analyze how my area fared in 2007. I have lots of this type of information at my disposal, so feel free to contact me for analysis.


