Year End Statistics – Was 2011 the New 2002?
I just received the year-end sales statistics and there are no surprises. The number of sales and prices are both down from last year pretty much all over the metro, but not substantially so. For the entire metro region (MLS), sales prices were down about 3.5% from 2010, and the number of pending sales was only down by about 1%.
What is interesting to me is to look at the numbers over the last 10 years and see if there are any connections. It appears that we have reverted back to a pre-boom market, circa 2002 or so. Could that really be the worst thing in the world? Not in my opinion, but hey, I bought my house in 2004 so I guess I am safe. Those that purchased real estate in 2006 might have a different story to tell. Regardless of your personal real estate stories, prices are currently reasonable and there are still a large number of sales every year. Not as many as in 2006, but the media and the entire country needs to stop comparing our current market to one that was spurred by illegal lending practices. This is a new normal, and as the economy rebounds so will real estate.
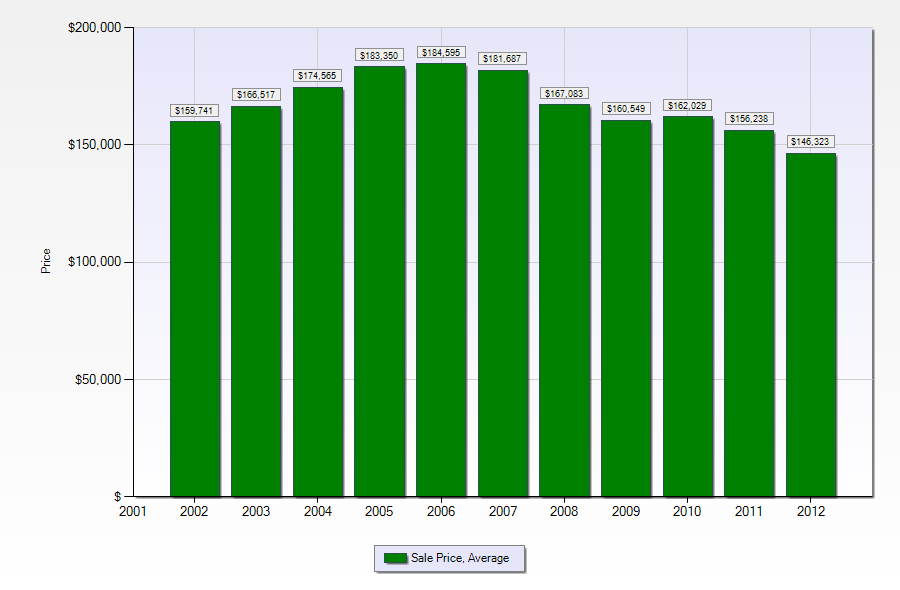
Here are a few charts showing sales prices over the last 10 years. You will see that prices compare to numbers seen in the early 2000’s. (Click to enlarge; disregard 2012 data.)
Johnson County: The 2011 average sales price matches closest to 2004 numbers.
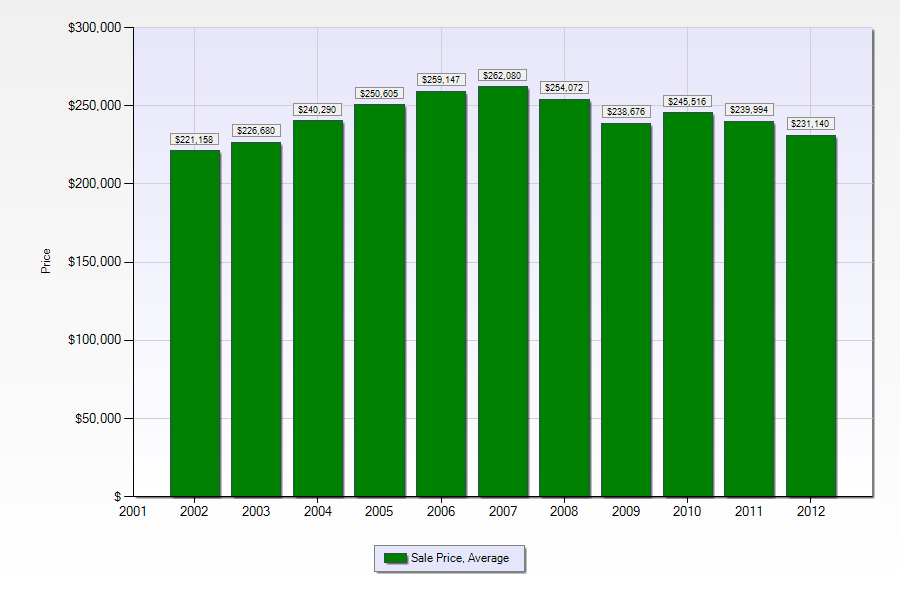
Jackson County: The 2011 average sales price matches closest to 2002 numbers.
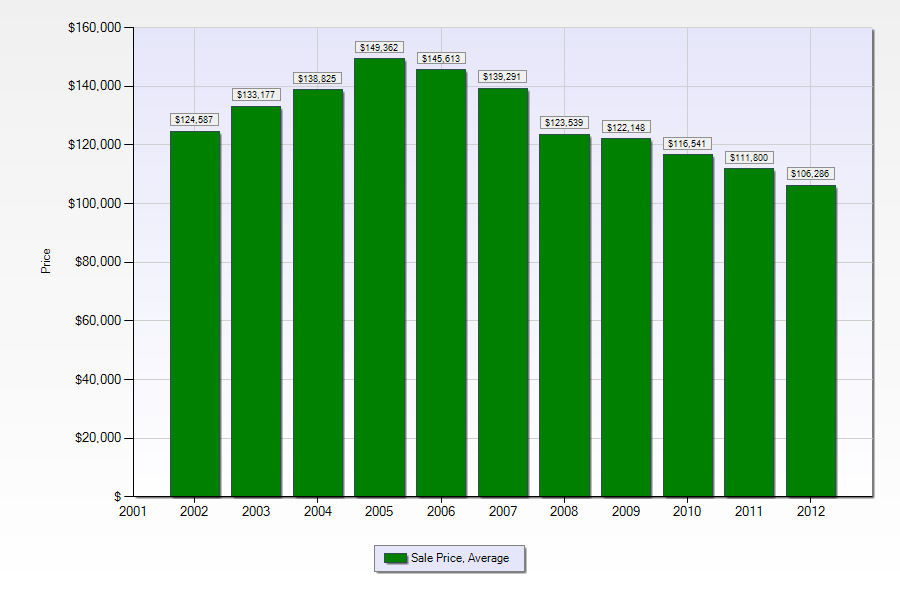
Entire MLS Area: The 2011 average sales price matches closest to 2002 numbers.
